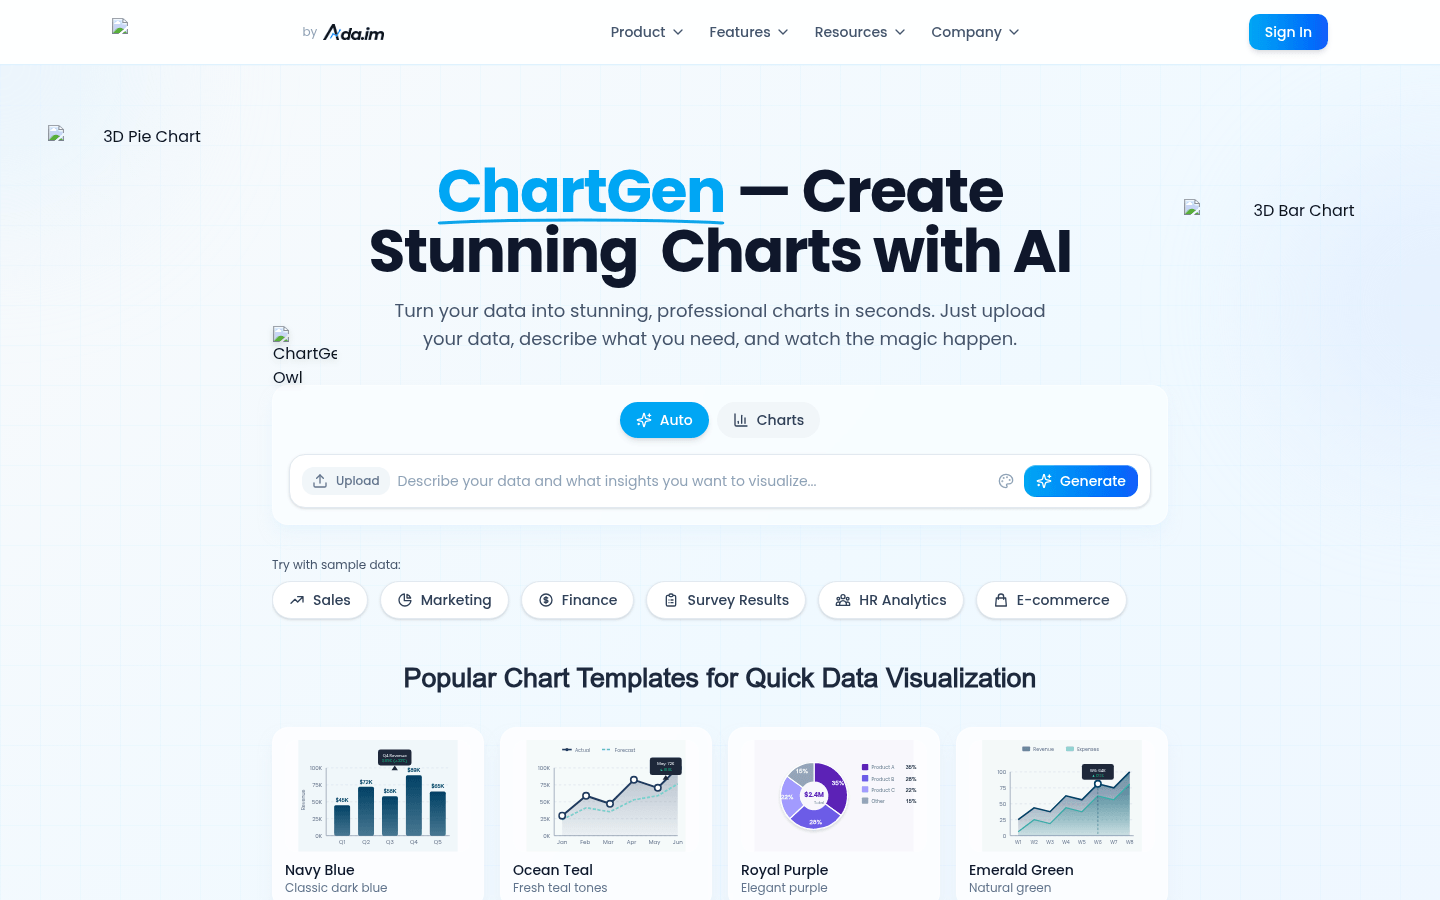
ChartGen.ai: Turn Data into Stunning Visuals Instantly
ChartGen.ai: Your Smart Chart Generator
Why Charts Matter More Than Ever
In today's data-driven world, numbers tell stories—but only if people can understand them. That's where ChartGen.ai shines. Imagine explaining your spreadsheet to a designer who instantly creates perfect visuals. That's essentially what this tool does, minus the back-and-forth emails.
Features That Make Data Sing
AI That Speaks Human
Forget complicated settings. Type "show sales by region as colorful bars" and watch magic happen. The AI understands natural language requests better than most interns!
Style For Days
Choose from 12 professional color themes—from corporate sleek to startup vibrant. Your quarterly report never looked this good.
Export Like a Pro
Need a tiny chart for Twitter? A massive one for your boardroom? Six size options plus PNG/SVG/PDF exports have you covered.
Real-Time Updates
The tool syncs with Google Sheets and databases too. Change your numbers? Your charts update automatically—no manual tweaking required.
Who's Using This?
- Marketing teams visualizing campaign performance
- Researchers making complex findings digestible
- Small businesses creating professional reports without design skills
- Teachers explaining statistics visually
- Bloggers turning dry data into shareable infographics
The best part? It's completely free to start with generous limits (50 charts/month). No "free trial" traps here—just instant value.
Try It Yourself Today
Ready to make your data dance? Visit ChartGen.ai and create your first chart in seconds.