Google's Gemini 3.1 Pro Now Crafts Data Reports Like a Pro Analyst
Google's Research Assistants Get Serious Upgrade
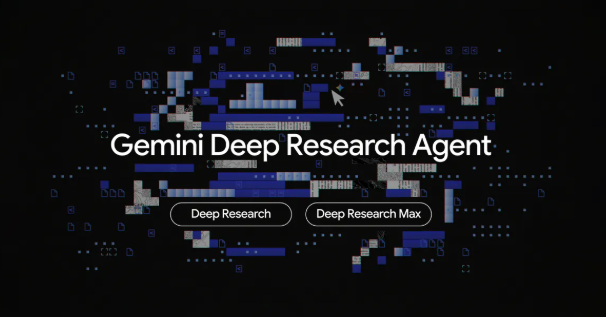
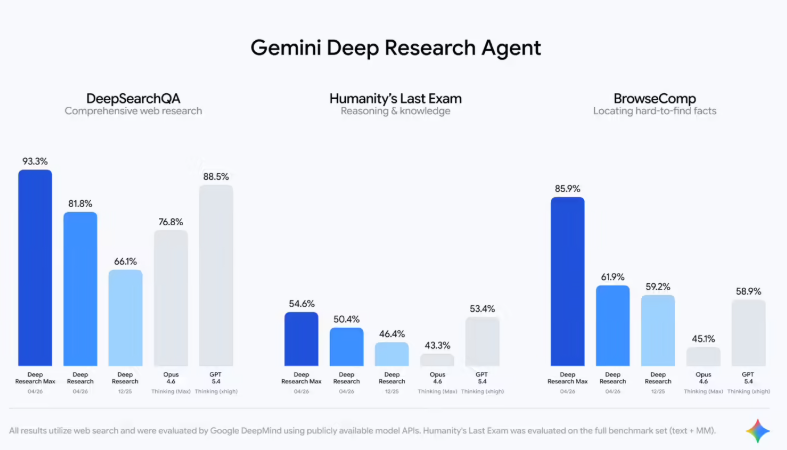
Tech giant Google has taken its AI assistants from simple chatbots to full-fledged research partners with the launch of Deep Research and Deep Research Max. Built on the powerful Gemini 3.1 Pro model, these tools aim to automate the tedious work of gathering and analyzing information - tasks that typically keep analysts burning the midnight oil.
Currently available through Google's paid Gemini API, these agents don't just scrape public websites. They can tap into private corporate databases too, thanks to newly supported protocols. The result? Detailed reports complete with proper citations - something that's been missing from most AI tools until now.
Two Flavors for Different Needs
Google understands that one size doesn't fit all when it comes to research:
- Deep Research prioritizes speed, delivering quick answers perfect for interactive applications where you need immediate feedback.
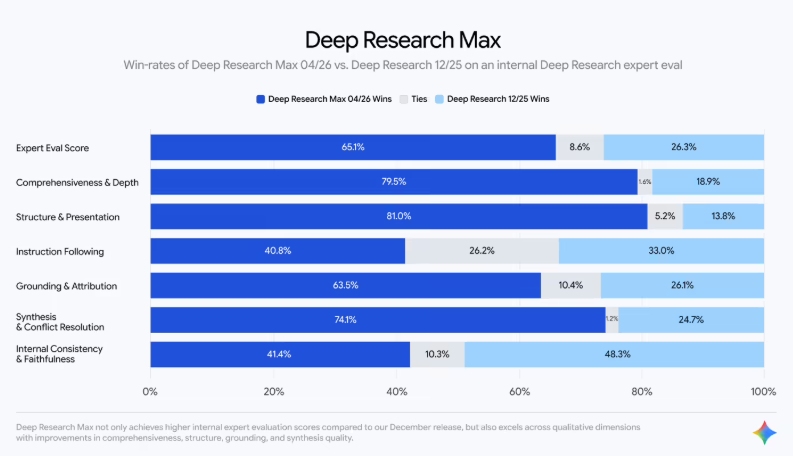
- Deep Research Max plays the long game, using extra computing power to methodically refine its analysis like a seasoned researcher pulling an all-nighter.
Breaking Down Data Silos
The real game-changer might be the new Model Context Protocol (MCP), which lets these AI agents access specialized financial and industry databases. This solves a major headache - how to combine public information with a company's private data treasure trove.
And here's something analysts will love: these tools don't just spit out raw data. They can transform findings into clear, professional charts and infographics. Users can even collaborate with the AI upfront to plan research strategies, ensuring the analysis stays on target.
Key Points:
- Google launches Deep Research and Deep Research Max powered by Gemini 3.1 Pro
- Tools automate complex research tasks from data collection to visualization
- New MCP protocol connects AI to private corporate databases
- Standard version prioritizes speed; Max version focuses on depth and quality
- Native chart generation turns data into ready-to-use visuals