ChartGen AI: Turn Data into Visual Stories Instantly
Product Introduction
Ever stared at a spreadsheet full of numbers and wished they could just explain themselves? ChartGen AI does exactly that - it's like having a data visualization expert in your pocket. 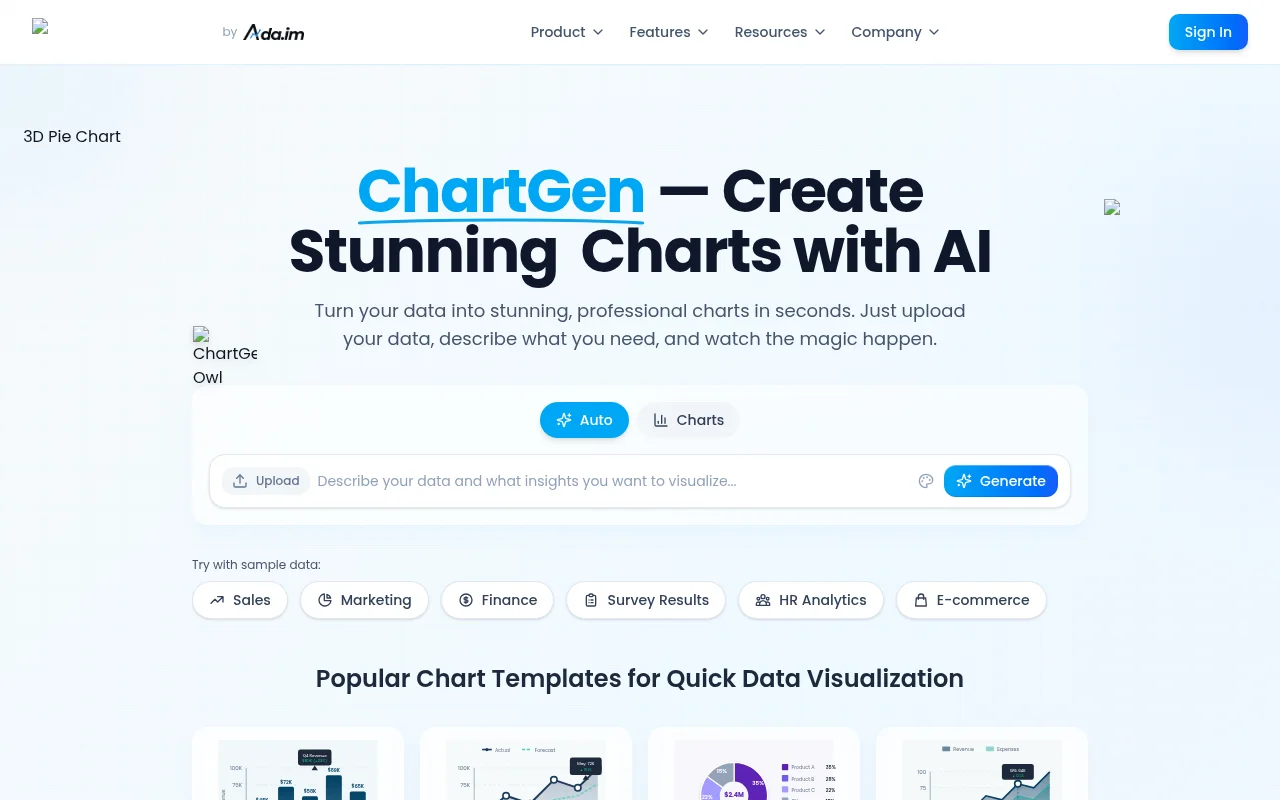 Whether you're preparing last-minute slides for a board meeting or analyzing campaign performance over coffee, this tool turns the tedious process of chart-making into something surprisingly enjoyable.
Key Features
Instant Chart Magic
Upload an Excel file or CSV, type what you need ('Show me sales by region as colorful bars'), and boom - you've got publication-ready visuals faster than you can say 'pivot table'.
Chart Buffet
Choose from:
- Classic column and bar graphs that make comparisons crystal clear
- Expressive pie charts perfect for budget breakdowns
- Sophisticated scatter plots revealing hidden correlations
- Heatmaps that make complex data feel intuitive
The variety means you'll always find the right visual language for your story.
Plain English Power
The secret sauce? You don't need to speak 'data viz.' Describe what matters ('Compare Q2 profits across departments') and let the AI handle the technical details.
Always Fresh Data
Connect live sources so your dashboards update automatically - no more exporting stale screenshots before meetings.
Shareworthy Outputs
export as:
- Crisp PNGs for presentations
- Scalable SVGs for web use
- Print-perfect PDFs or embed directly in reports.
Enterprise-Grade Security
The team takes privacy seriously with SOC 2 and GDPR compliance - your sales figures stay yours.
Product Data
Best For: Business analysts drowning in spreadsheets, marketers proving campaign ROI, HR teams visualizing employee surveys - really anyone who needs to make numbers meaningful fast. Learning Curve: About as steep as a wheelchair ramp. If you can describe what you want to see, you're qualified. Sweet Spot: When you need great-looking charts yesterday without hiring a designer. Limitations: While it handles common business data beautifully, complex scientific visualizations might still require specialized tools.